Flood Monitoring with SAR
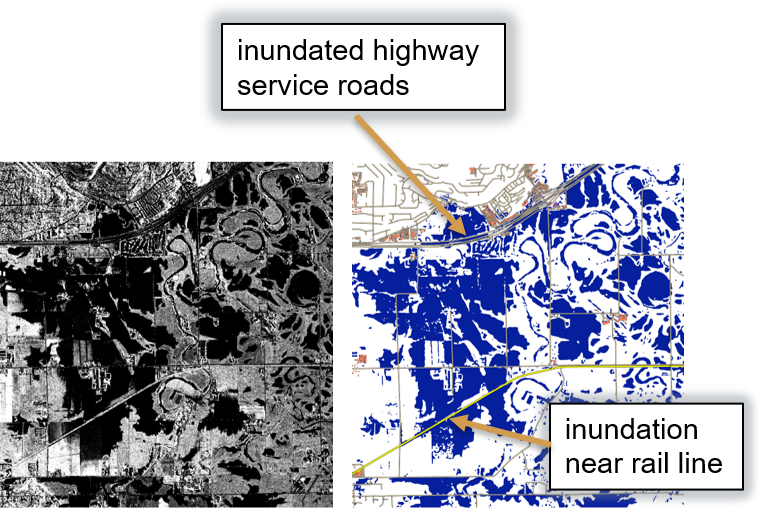
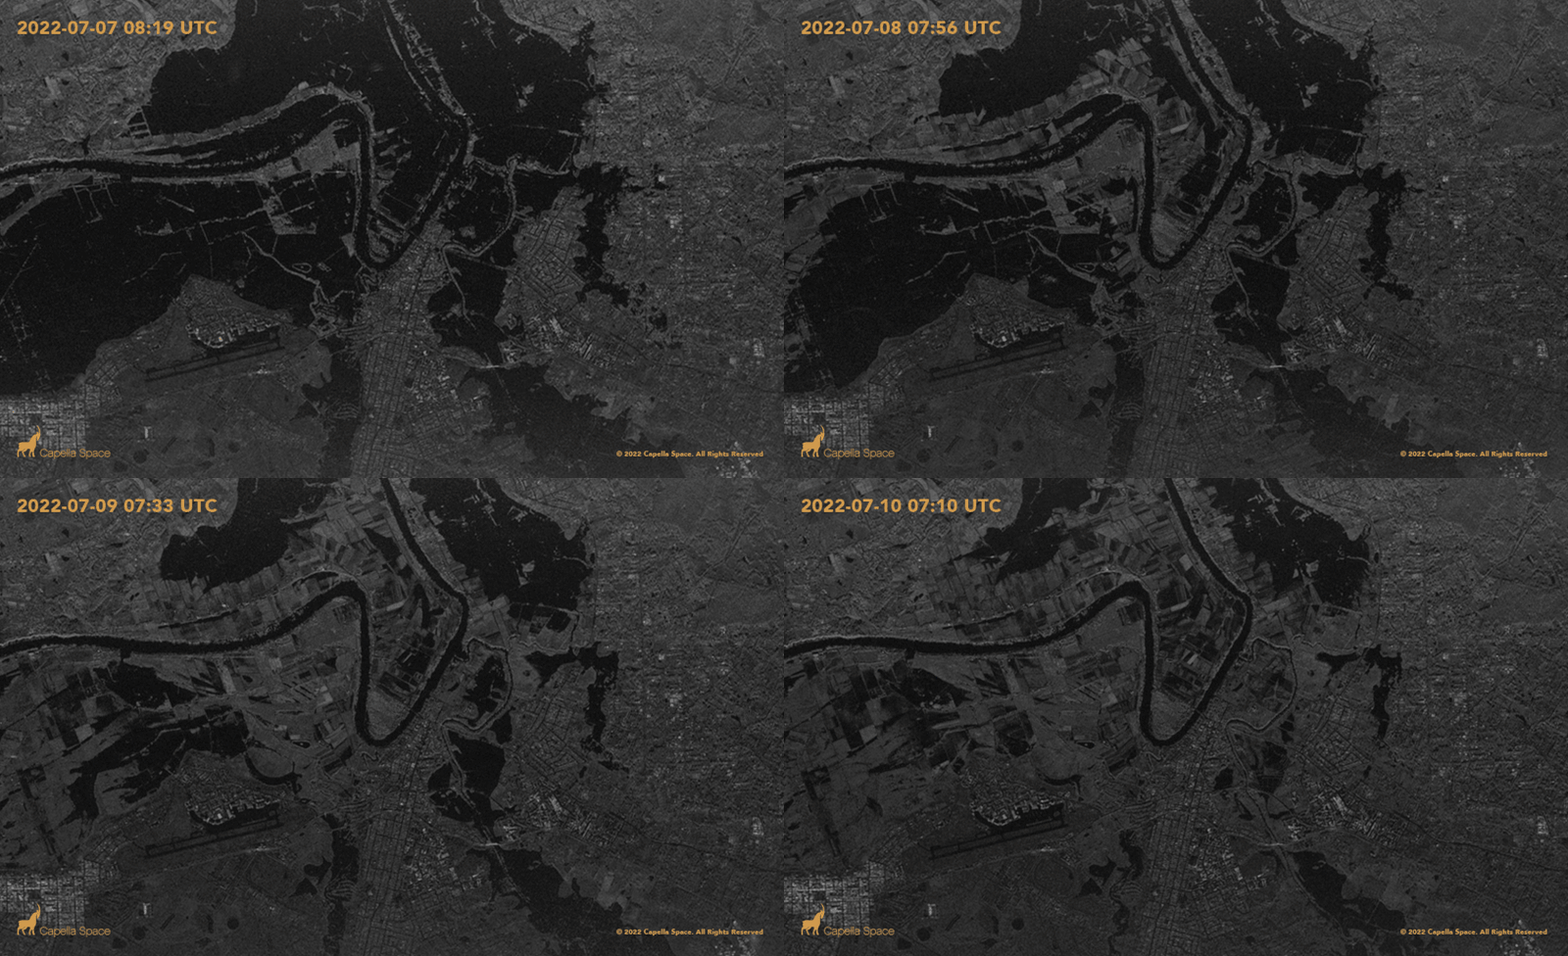
Awareness of changing ground conditions is critical for effective disaster response, making satellite imagery an important source of this information today. At Capella Space and ICEYE, I have helped develop tools to help endusers task and interpret commercial SAR imagery quickly for flood mapping.
What is SAR ?
Most people are familiar with optical satellite imagery (observed in the visible range of the electromagenetic spectrum). These kind of images are passively sensed, meaning that the sun acts as a light source, similar to a camera without flash.
Synthetic Aperture Radar (SAR) is a radar system that uses microwaves to create detailed images of the Earth’s surface. It’s called “synthetic aperture” because it uses advanced processing techniques to simulate a much larger antenna than what’s actually physically possible.
SAR works by transmitting radio waves from a radar antenna on a platform (like a satellite or airplane) towards the ground. The waves reflect off of objects and return to the antenna, where they’re recorded. By measuring the time it takes for the waves to travel and bounce back, SAR can determine the distance to the objects on the ground.
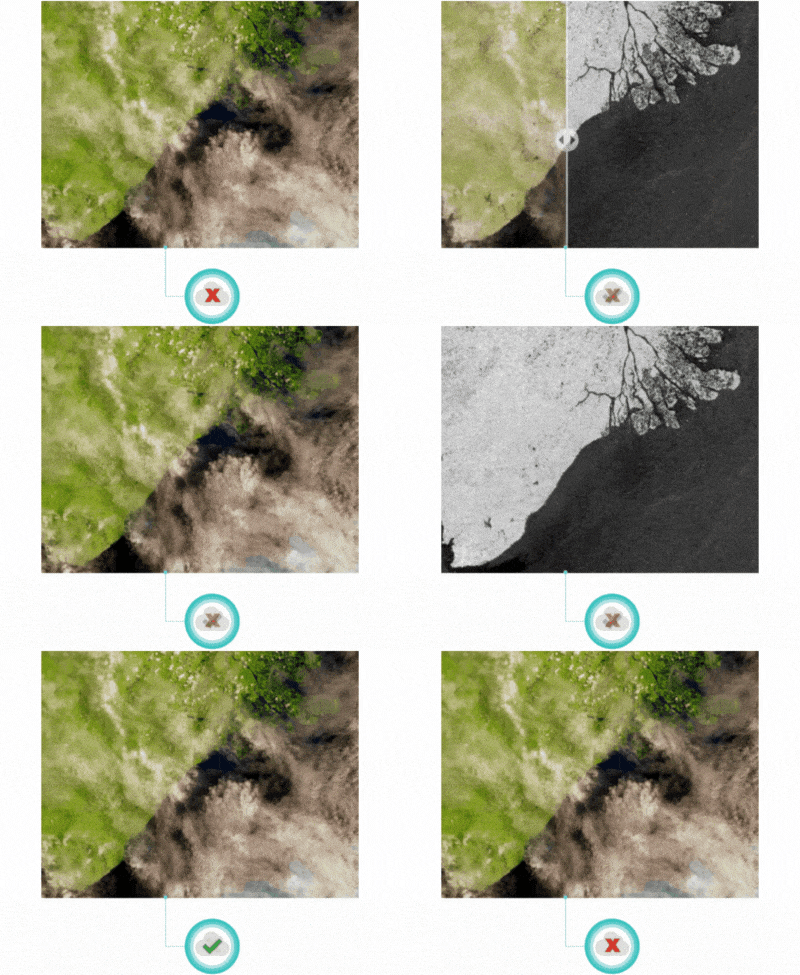
Active sensors like SAR can help deliver timely information day or night and through cloudy conditions. SAR is used for a wide variety of applications, from mapping and monitoring changes in the Earth’s surface to tracking ships and detecting oil spills in the ocean.
Here are some great resources to learn more about SAR:
Mapping Water from Radar
Researchers have been mapping water from SAR for nearly 30 years – this is not a new concept! But, as computing resources and image spatial resolution continue to improve, modeling techniques have also grown more sophisticated. Succesful flood detection techniques range from simple amplitude thresholding and unsupervised clustering - to supervised ML methods (Random Forest, SVMs, etc) and deep learning segmentation methods. Generally, the further right in this chart you go- the greater the computational demand and need for more training data.
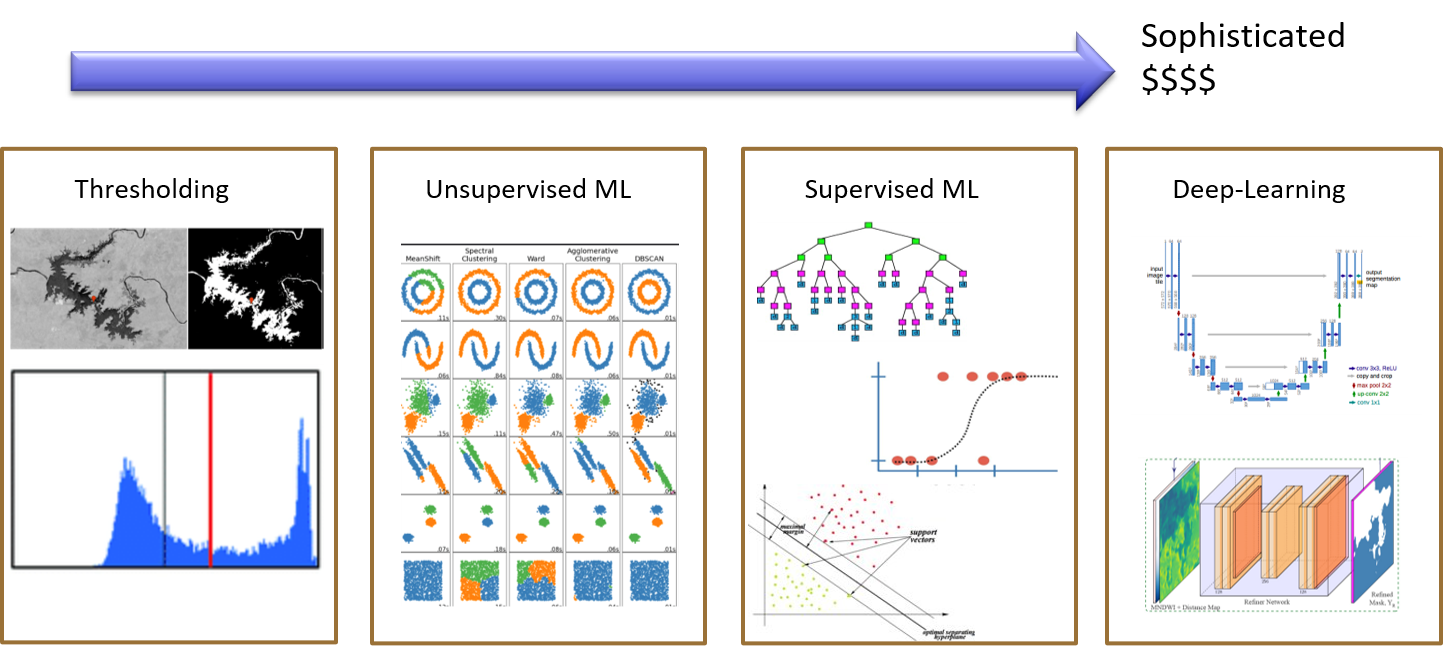
While working on this project, we started prototyping this work starting at the simpler end of the modeling spectrum. As we built up an archive of flood images and high quality annotations, we iterated on a variety of different models and slowly worked our way to the more sophisticated end of the modelling techniques, ultimately using a U-Net convolutional neural network.
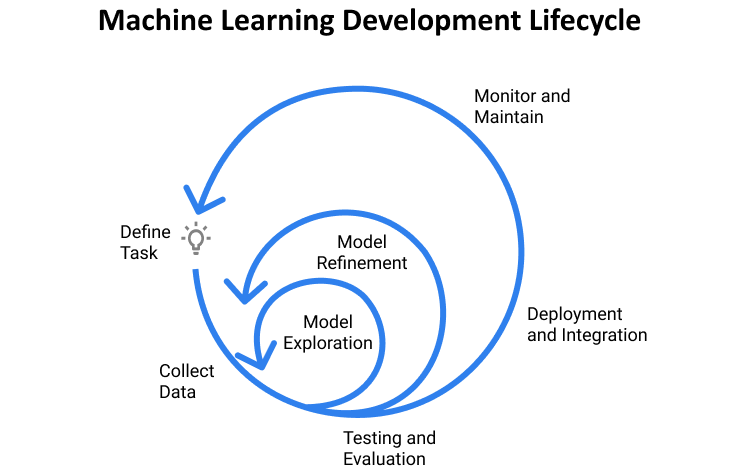
We now can run our model on any Capella image and deliver maps of estimated flood and persistent water masks using a suite of auxiliary geospatial data (historical satellite imagery from Landsat, Sentinel-1 and Sentinel-2, elevation from a DEM, and infrastructure data layers)
